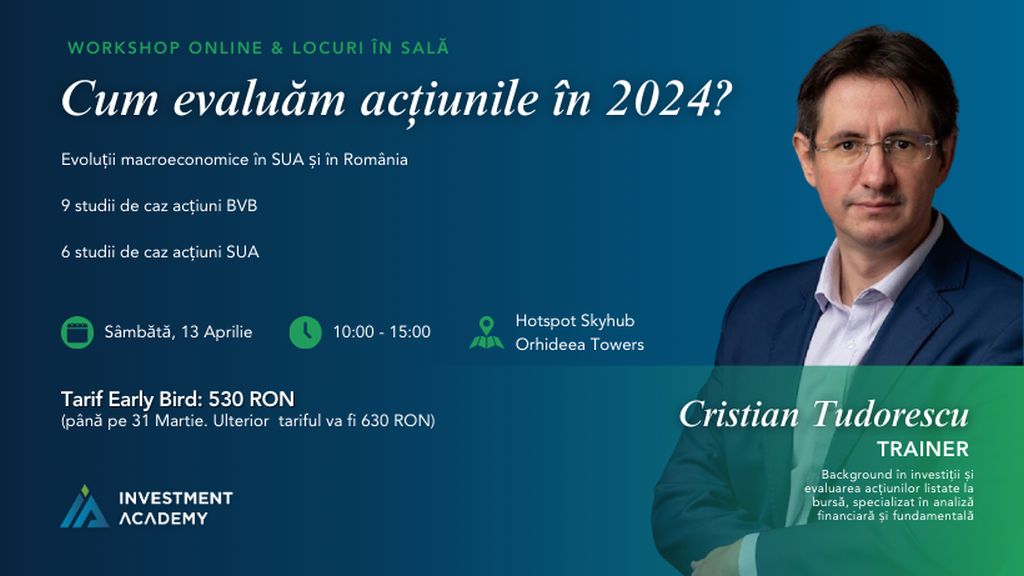
Friday, May 24th
financial raport of progopo-impex-srl rapoarte financiare ale progopo-impex-srl
Search
Acest site utilizeaza cookie-uri (click aici pentru detalii).
PROGOPO IMPEX S.R.L.
HOMEPAGE NEWS BUSINESS DIGEST MAJOR COMPANIES COMPANIES FINANCIAL PROFILES REAL ESTATE EVENTS

Quick search:  CUI:  J:     

PROGOPO IMPEX S.R.L.


Identification data for PROGOPO IMPEX S.R.L.


Fiscal identification code: 11988710
Registry of commerce number: J16/493/1999

Main activity of PROGOPO IMPEX S.R.L.


CAEN: comert cu ridicata al materialului lemnos si al materialelor de constructii si echipamentelor sanitare

Contact information of PROGOPO IMPEX S.R.L.


Address: ALBESTI, County: DOLJ
Extended profile of PROGOPO IMPEX S.R.L. on kompass.com

Company profile for PROGOPO IMPEX S.R.L. on doingbusiness.ro

Balance Sheet20072008200920102011
Total fixed assets1,887,8931,531,8551,300,9923,971,7374,167,241
Total current assets3,982,5694,158,0213,662,9942,947,8973,406,372
Inventory1,152,2261,654,5931,334,287912,0811,300,013
Cash and deposits266,846425,642623,937605,933314,207
Total receivables2,563,4972,077,7861,704,7701,429,8831,792,152
Total capital2,191,4212,029,2062,079,2662,324,5032,008,847
Paid-in capital300,000500,000500,000500,000500,000
Loss provisionsN/AN/AN/AN/AN/A
Total debt3,679,0413,665,0252,886,2614,600,0895,572,435
Profit and Loss20072008200920102011
Annual turnover13,593,04515,317,01213,508,51811,742,04412,742,875
Total revenues13,797,22515,921,06613,618,64611,849,18812,943,392
Total expenses13,017,29215,046,64112,550,61411,085,57112,450,097
Profit before tax779,933874,4251,068,032763,617493,295
Net profit664,358759,035904,401635,544405,032
No of employees3732272929
Balance Sheet Ratios20072008200920102011
Debt to equity ratio1.67881.80611.38811.97902.7739
Total debt to total assets1.94882.39252.21851.15821.3372
Shareholder's equity to total assets1.16081.32471.59820.58530.4821
Profitability Ratios20072008200920102011
Profit before tax margin (%)5.73775.70887.90646.50333.8711
Net profit margin (%)4.88754.95556.69505.41253.1785
Before tax ROE (Return On Equity)35.590343.184751.403932.921024.6502
After tax ROE (Return On Equity)30.316337.486043.528427.399520.2397
Operating Ratios20072008200920102011
Inventory turnover (days)30.939539.428536.052428.351937.2369
Receivables turnover (days; VAT adjusted)57.844541.607638.708337.351043.1373
Total assets turnover (times)1.94882.39252.21851.15821.3372
Annual Turnover (2007-2011)
Evolution of Turnover vs. Sector Average
The graph shows the evolution of annual turnover of the company PROGOPO IMPEX S.R.L. in 2007 - 2011. The graph shows the evolution of turnover of the company PROGOPO IMPEX S.R.L., compared with the average turnover of the main activity of which it forms part, surrounding the company in one of the quartile.
Chart.
Chart.
Total Assets (2007-2011)
Evolution of Total Assets vs. Sector Average
The graph shows the evolution of total assets (calculated as the sum of the fixed assets and current assets) for PROGOPO IMPEX S.R.L.in 2007- 2011. The graph shows the evolution of total assets (calculated as the sum of the fixed assets and current assets) compared with the average turnover of the main activity of which it forms part
Chart.
Chart.
Total Debt (2007-2011)
Total Debt/ Total Assets (%)
The graph shows the evolution of total debt for the company PROGOPO IMPEX S.R.L. in 2007 - 2011. The graph shows the evolution of the ratio between total debt and total assets of PROGOPO IMPEX S.R.L.in 2007-2011 as a percentage.
Chart.
Chart.
Profit Before Tax (2007-2011)
Profit Before Tax Margin (%)
The graph shows the evolution of gross profit for the company PROGOPO IMPEX S.R.L.. The graph shows the evolution ratio between gross profit and turnover of PROGOPO IMPEX S.R.L.in 2007-2011.
Chart.
Chart.


Legend:

Garnet line: divides companies' performance in (2) two halves: upper and lower;
Green line: divides performance of the upper half companies in two quarters: "top quarter" and "above average quarter";
Red Line: divides performance of the lower half companies in: "below average performance" and "lowest performance";
White background: represent the top half of each quarter;

This financial report is based on freely available data published by official sources. The liability for this company profile belongs to these sources. Please contact us for further information
back to top | home | contact
Sitemap: Business Digest Articole ultima editie Articole recente Opinii Companies Major Companies Companii Financiar Real estate Publications Market Overview New projects Events Realitatea in Afaceri Arhiva evenimente News Sitiri afaceri Stiri companii Evenimente de afaceri
RSS
© Copyright International Business Promotion